Sunspots
Suitable for Year Levels 9 and 10
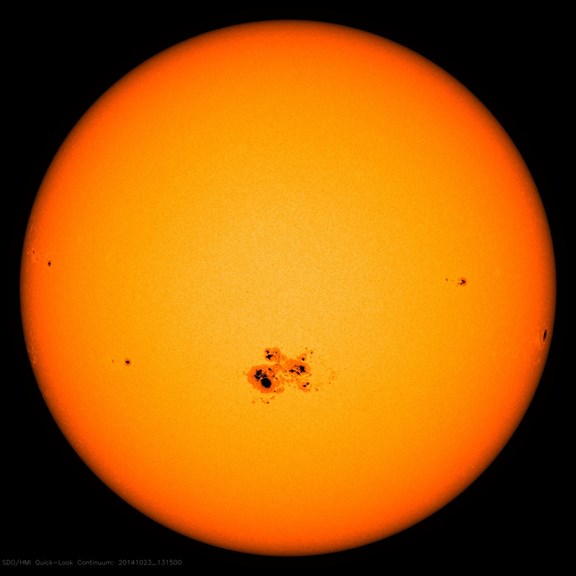
Sunspots are dark patches that appear on the Sun’s photosphere (the visible surface of the Sun). They are typically about 2000 degrees Celsius cooler than the surrounding areas. The number of sunspots varies over a regular 11-year cycle. The following activity requires you to observe the number of sunspots on the Sun over a week or month. (Note: You should never look directly at the Sun. Doing so can permanently damage your eyes.) A typical sunspot is usually as big as the Earth, but can be up to ten times this size. Sunspots are linked to intense magnetic fields on the Sun.
SOHO is a spacecraft designed to study the internal structure of the Sun, its extensive outer atmosphere and the solar wind. SOHO (Solar Heliospheric Observatory) was launched in 1995 as a joint project between the European Space Agency and NASA. You can see an image of the Sun, complete with sunspots, as it looks today by simply going to the SOHO website.
- At the SOHO website click on the image below the word Sunspots in the right-hand column. You should see an image of the Sun as it looks today complete with sunspots.
- Refer to the left-hand column. Scroll down to find ‘Sunspot number’ and the date. Record the date and the number of sunspots.
- Revisit these websites daily. Record the number of sunspots for at least a month.
- When you have collected all your data, draw a graph showing the number of sunspots per day and a draw a line of best fit through the points to see whether a pattern emerges.
Use the information available through the SOHO website and its related links to help you answer the following questions.
- What are sunspots?
- How might sunspots have an effect on the Earth’s weather?
- What are some other effects sunspots have on Earth?
- What shape or pattern does your graph make? Explain.
- Does the number of sunspots seem to increase or decrease over the month?
- Investigate the historic data on the spaceweatherlive website and find out what the pattern of sunspots on the Sun was during the year you were born. Was there anything special about the pattern of sunspots that year? What do you notice about the number of sunspots over the last 50 years? (Find Solar Activity in the top menu and then click Solar Cycle.)
Victorian Curriculum Links
Science – Earth and Space Sciences Year 9 and 10
The Universe contains features including galaxies, stars and solar systems; the Big Bang Theory can be used to explain the origin of the Universe. (VCSSU129)


